Capturing measurements in Google Analytics
Before you can send data to Google Analytics, you have to add the analytics.js library and the default tracking snippet to your page.
The analytics.js tracking snippet does four main things:
- Creates an asynchronous
<script>element that downloads the analytics.js JavaScript library. - Initializes a global
ga()function (called the ga() command queue) that allows you to schedule commands to be run once the analytics.js library is loaded and ready to go. - Adds a command to the
ga()command queue to create a new tracker object for the property specified via the'UA-XXXXX-Y' parameter. - Adds another command to the
ga()command queue to send a pageview to Google Analytics for the current page.
While the data collected from pageviews alone is useful, it doesn't tell the whole story. To get a better picture of how users are experiencing your site or application, you have to send additional interaction data to Google Analytics.
Google Analytics supports several types of interaction data: pageviews, events, social interactions, exceptions, and (last but not least) user timings. To send user timing data to Google Analytics, you can use the following command signature:
ga('send', 'timing', timingCategory, timingVar, timingValue);
Where timingCategory is a string that allows you to organize timing hits into logical group, timingVar is the variable you're measuring, and timingValue is the actual time duration in milliseconds.
To get to the User Timing reports in Google Analytics, click on the Reporting tab at the top and select "Behavior > Site Speed > User Timings" from the sidebar navigation (or follow the instructions to view the User Timings report from the Help Center).
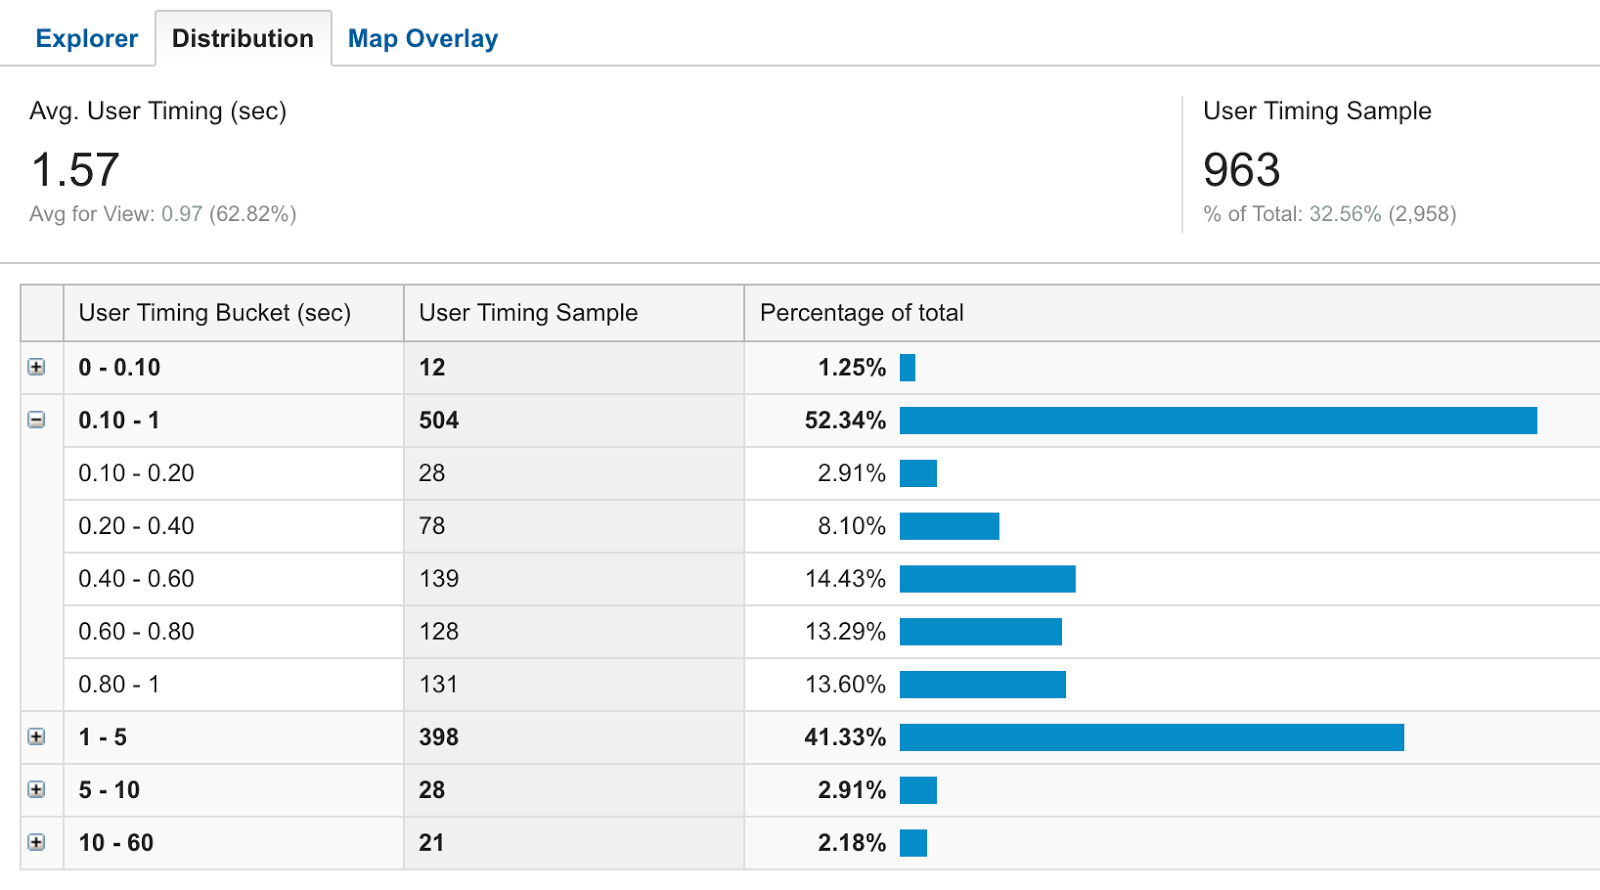
When you load User Timings report in Google Analytics, you should be able to see the timing categories that correspond to the data you sent. Click on any of those to see detailed visualizations of your timing data. The follow image is an example of font load times on a real website using Google Fonts over the last 24 hours.
If you need help to
- accurately and effectively measure performance metrics using the
User Timings API - send that data to Google Analytics so it can be incorporated into your reports
Contact me at https://www.linkedin.com/in/ssyap