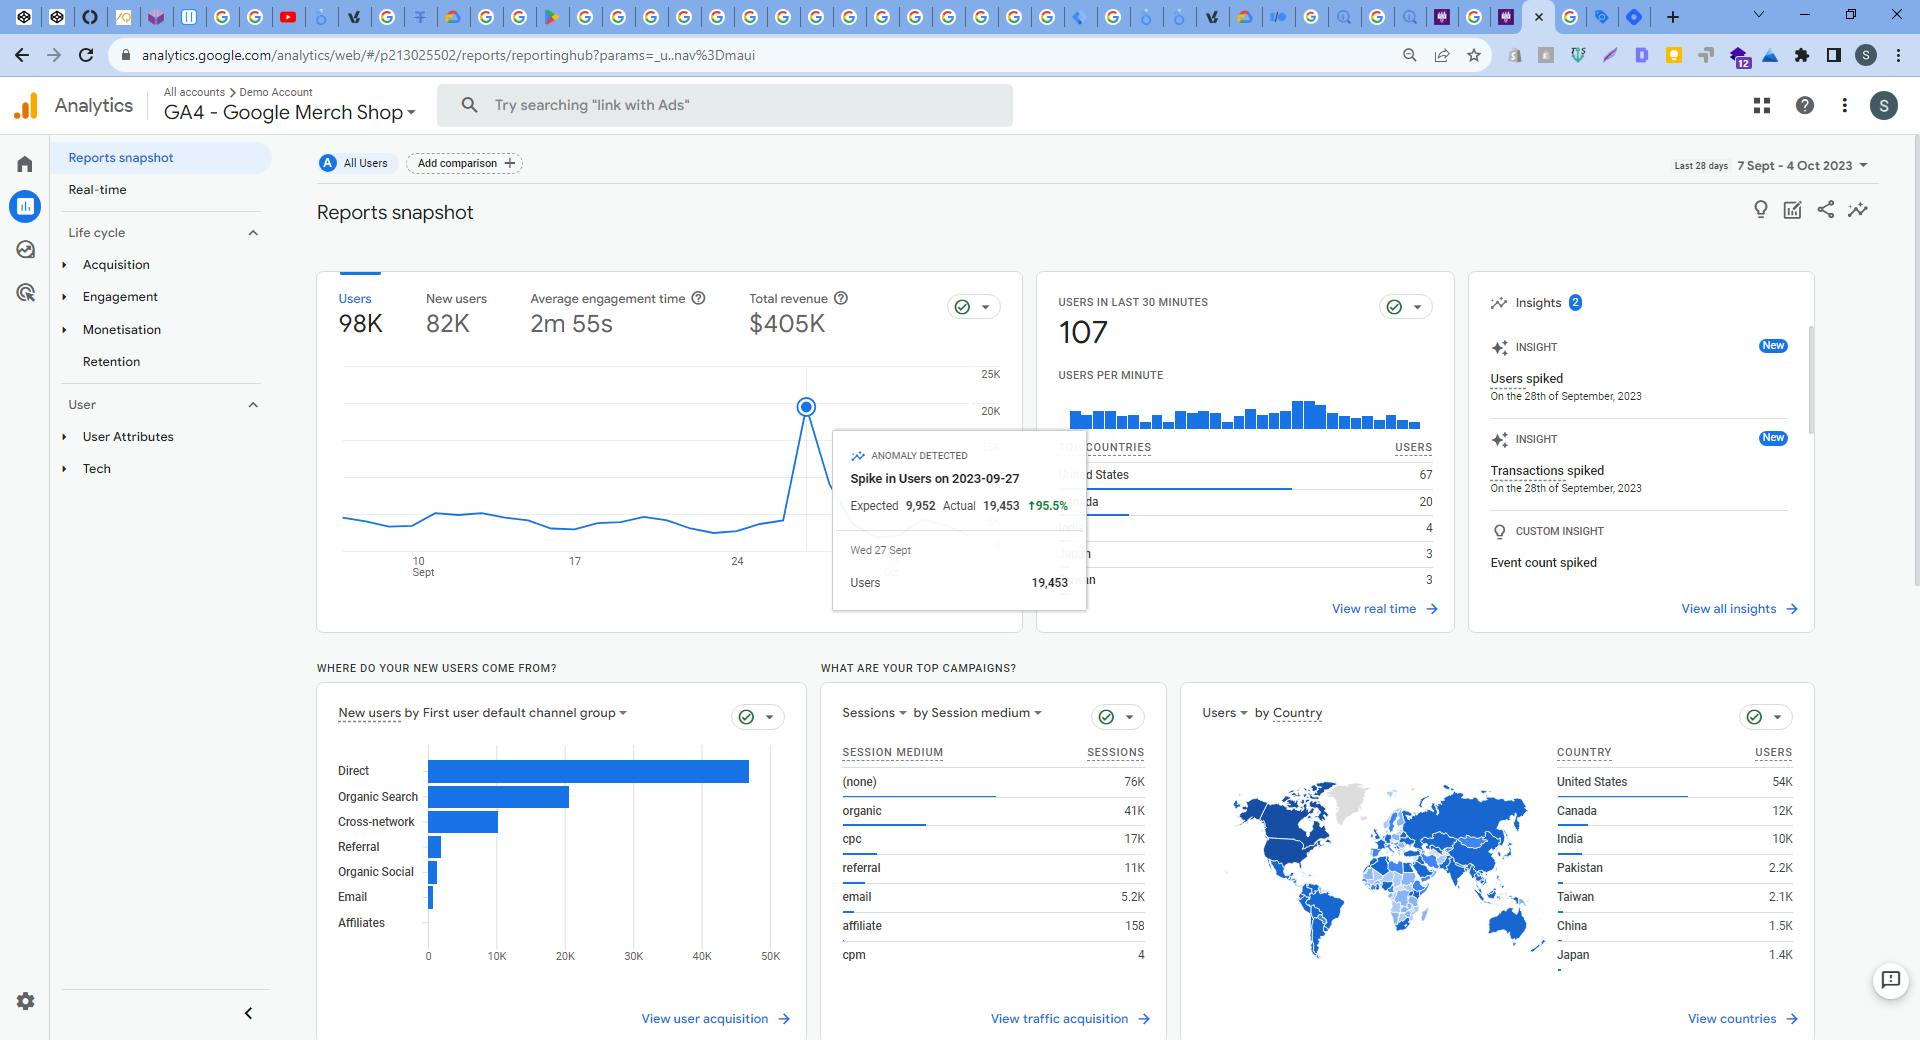
In the last week of September 2023, Google Merch store saw unusually high traffic spike.


Investigate a spike in your data
Some pointers
Is this metric important?
Is the spike just a natural variation?
Consider seasonal trends and natural cycles
Is there a data quality issue?
Segment the data, follow the breadcrumbs
Have we changed anything internally?
Anomaly detection in Google Analytics 4
This article discusses what anomaly detection is and how it works. It also details the 2 methods uses to identify anomalies over several metrics and dimension values.:
time-series based anomaly detection
anomaly detection simultaneously
Important points from this article are that the training period for hourly anomalies is 2 weeks, the training period for daily anomalies is 90 days, and the training period for weekly anomalies is 32 weeks.
Additionally, if any particular segment demonstrates anomalous behavior across any metric and comprises at least 0.05% of the users on that property, it will be surfaced as an anomaly.
Drilling Down
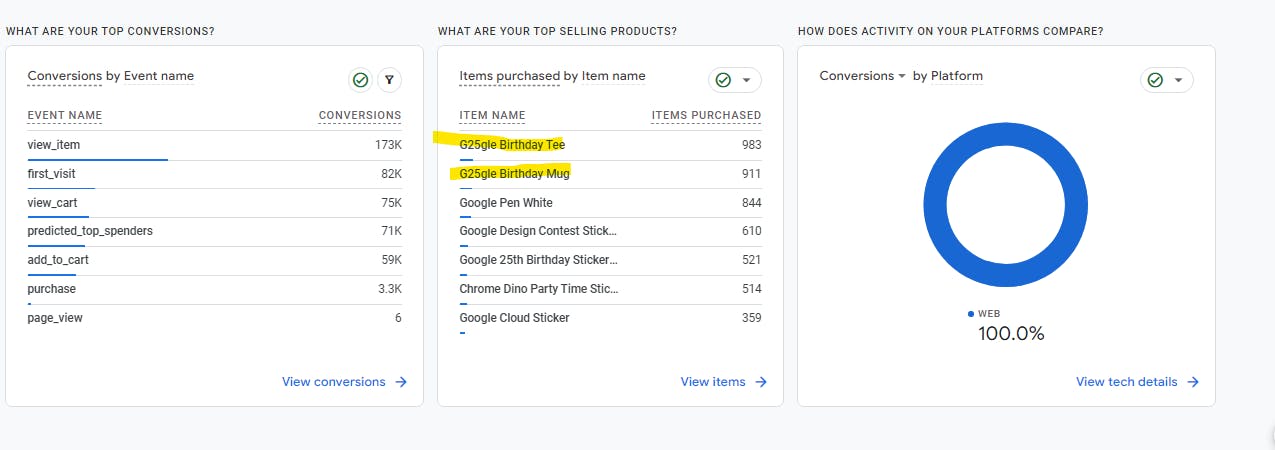
Anniversary-related mementos are the most purchased items.

This spike is the result of Google 25th Anniversary. (1998 - 2023)

